Deliberately different diversification
Technical Article
Publication date:
05 November 2019
Last updated:
25 February 2025
Author(s):
Ben Kumar, Technical Connection
Global equity investing.
Investors know the mantra. Diversification makes sense. Don’t put all your eggs in one basket! It is excellent advice – and even though no one buys baskets of eggs anymore, the example works.
But it’s also worth checking your baskets before you go home from the market. Are the baskets strong – will they survive the journey? Are you sure the baskets aren’t too full? Can you carry them comfortably? Do you even want all of the eggs?
The financial world isn’t always as sensible as the egg-carrying world … it’s always worth checking your investment baskets. For example, let’s look at global equity investing.
Read the label. There are lots of ways to invest globally. The MSCI World index includes over 1600 companies. An iShares ETF tracking this index has over $5 billion under management. This sounds sensible; you’re investing in shares all over the world – how much more diversified can you get? Well, once you check the basket …
Names can be misleading. The MSCI World index only covers Developed Markets. Only 23 countries are represented, out of 195. The index contains no Chinese companies. No India. No Brazil or South Africa. No Emerging Market companies at all.
The global index that does include Emerging Markets is the less snappily titled MSCI ACWI (All-Countries World Index). Lots of investors know this – the iShares ETF tracking the ACWI has $10 billion in it. So, is this the basket you want?
The devil is in the detail. The MSCI ACWI covers a great deal of the world economy. It doesn’t include every single country (despite the name) – many of the 195 nations don’t have investable markets – but has 50 of the biggest. China, India and Brazil are there, as are Egypt, Pakistan, and Qatar, among others. So, the Emerging Markets are represented – but not in the size you might expect.
If you want to invest globally, common sense might suggest that you allocate your investments roughly according to size. The US is the largest economy in the world, making up one quarter of global GDP – so would need a decent chunk of your investment. China and Europe (excluding the UK) are each around one sixth of the total. Their allocations should probably be a bit smaller than the US, but still substantial.
The MSCI ACWI coverage is quite different. Over 55% of the index is invested in US companies – more than twice the economic weight of the US. European companies are around 12% of the index, compared to nearly 20% of global GDP. The biggest difference is China. The second largest economy in the world makes up just 4% of company weight in the ‘All-Countries World’ equity index.
So, is that the exposure you expected? Hugely focussed on the US? Little in other parts of the world that are doing well – especially China? Donald Trump might like the sound of this portfolio, but is it sensible?
Home isn’t always where the heart is. Of course, companies can be listed in a country and have very little to do with it. Just because BP has its headquarters in London doesn’t mean it only sells oil in Britain. Apple might be American, but iPhones are a global phenomenon. What matters is not where a company is based, but where it does business.
Source: Datastream
One way to look at this is to break down the sales exposure of the companies in the MSCI ACWI index. Where do they actually make their money?
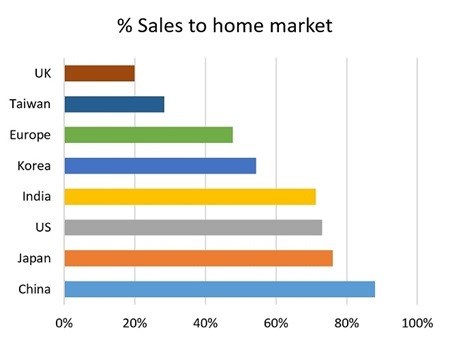
The chart shows the amount of sales that the companies listed in a country make from their home market. Some equity markets are global, and others are far more domestic.
The UK has lots of global companies listed there for the London postcode. Some have little or nothing to do with the UK economy. In fact, only 20% of the sales of UK-listed businesses actually come from here.
With China, the opposite is true. Over 88% of Chinese company sales are in mainland China. With 1.2 billion potential buyers, perhaps that’s no surprise.
European companies are evenly split, with half of sales internal, the rest external, while the US story is very similar to China, with 75% of company sales inside its borders.
Breaking the ACWI down in this way – by sales rather than country of listing – does help balance things out a little. Europe accounts for almost the same share of global sales as it does of the global economy, and China becomes a little bit better represented, rising to 9% of the total exposure.
Ultimately though, the US still dominates. If you have a lot of US companies, you’ll have a lot of US exposure. Even on a sales basis, the US is still 50% of the portfolio – double its share of the global economy.
Deliberately different. At 7IM, our portfolios look a bit different to many of the others out there. We invest in proportions closer to the economic world, rather than the way the financial world portrays it. We also look at the underlying revenue exposure of businesses, which is more revealing than the country of listing.
We know that in order to be exposed to the growth in China, the only real option is to invest in China – so we do. This is also true of many other economies that are undersold by the MSCI index, particularly the Emerging Markets.
In fact, when we look at the revenue exposure of our equity portfolios, over one quarter comes from the Emerging Markets. That’s great, because that’s where the growth is in the world over the long term.
We’re also far less dominated by the United States, largely because we have a portfolio allocation that is closer to the US GDP weight.
Our portfolios don’t match the economic world exactly – ultimately there is no ‘perfect’ diversified portfolio. What we’re looking to do is capture the big picture in a sensible way.
We check our baskets, and then we worry about the eggs.
Source: Datastream
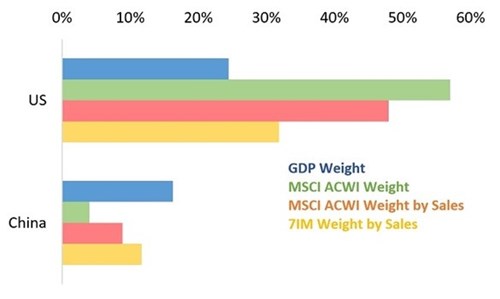
The economic and financial worlds don’t always align. The US is around 25% of global GDP (blue bars), but is nearly 60% of the MSCI All-Countries World Index (green bars). The opposite is true for China – 16% of global GDP, but under 4% of the ‘World’ index.
Broken down by where companies make their sales (red bars), the picture gets a little better – the US is 50%, and China rises to 9%.
But to start diversifying properly, you need to do something different. For us, that means having allocations that can seem out of sync with the rest of the industry, but get our investors much closer to actually reflecting the real world (yellow bars).
This document is believed to be accurate but is not intended as a basis of knowledge upon which advice can be given. Neither the author (personal or corporate), the CII group, local institute or Society, or any of the officers or employees of those organisations accept any responsibility for any loss occasioned to any person acting or refraining from action as a result of the data or opinions included in this material. Opinions expressed are those of the author or authors and not necessarily those of the CII group, local institutes, or Societies.