Investment Planning; November inflation numbers and more.
Technical article
Publication date:
14 January 2021
Last updated:
19 February 2026
Author(s):
Technical Connection
Investment planning update from 10 December 2020
- The November inflation numbers
- Another decent year for bonds
- Borrowing jumps
- A poor year for UK shares…but it could have been worse
The November inflation numbers
(AF4, FA7, LP2, RO2)
The CPI inflation in November was 0.3%
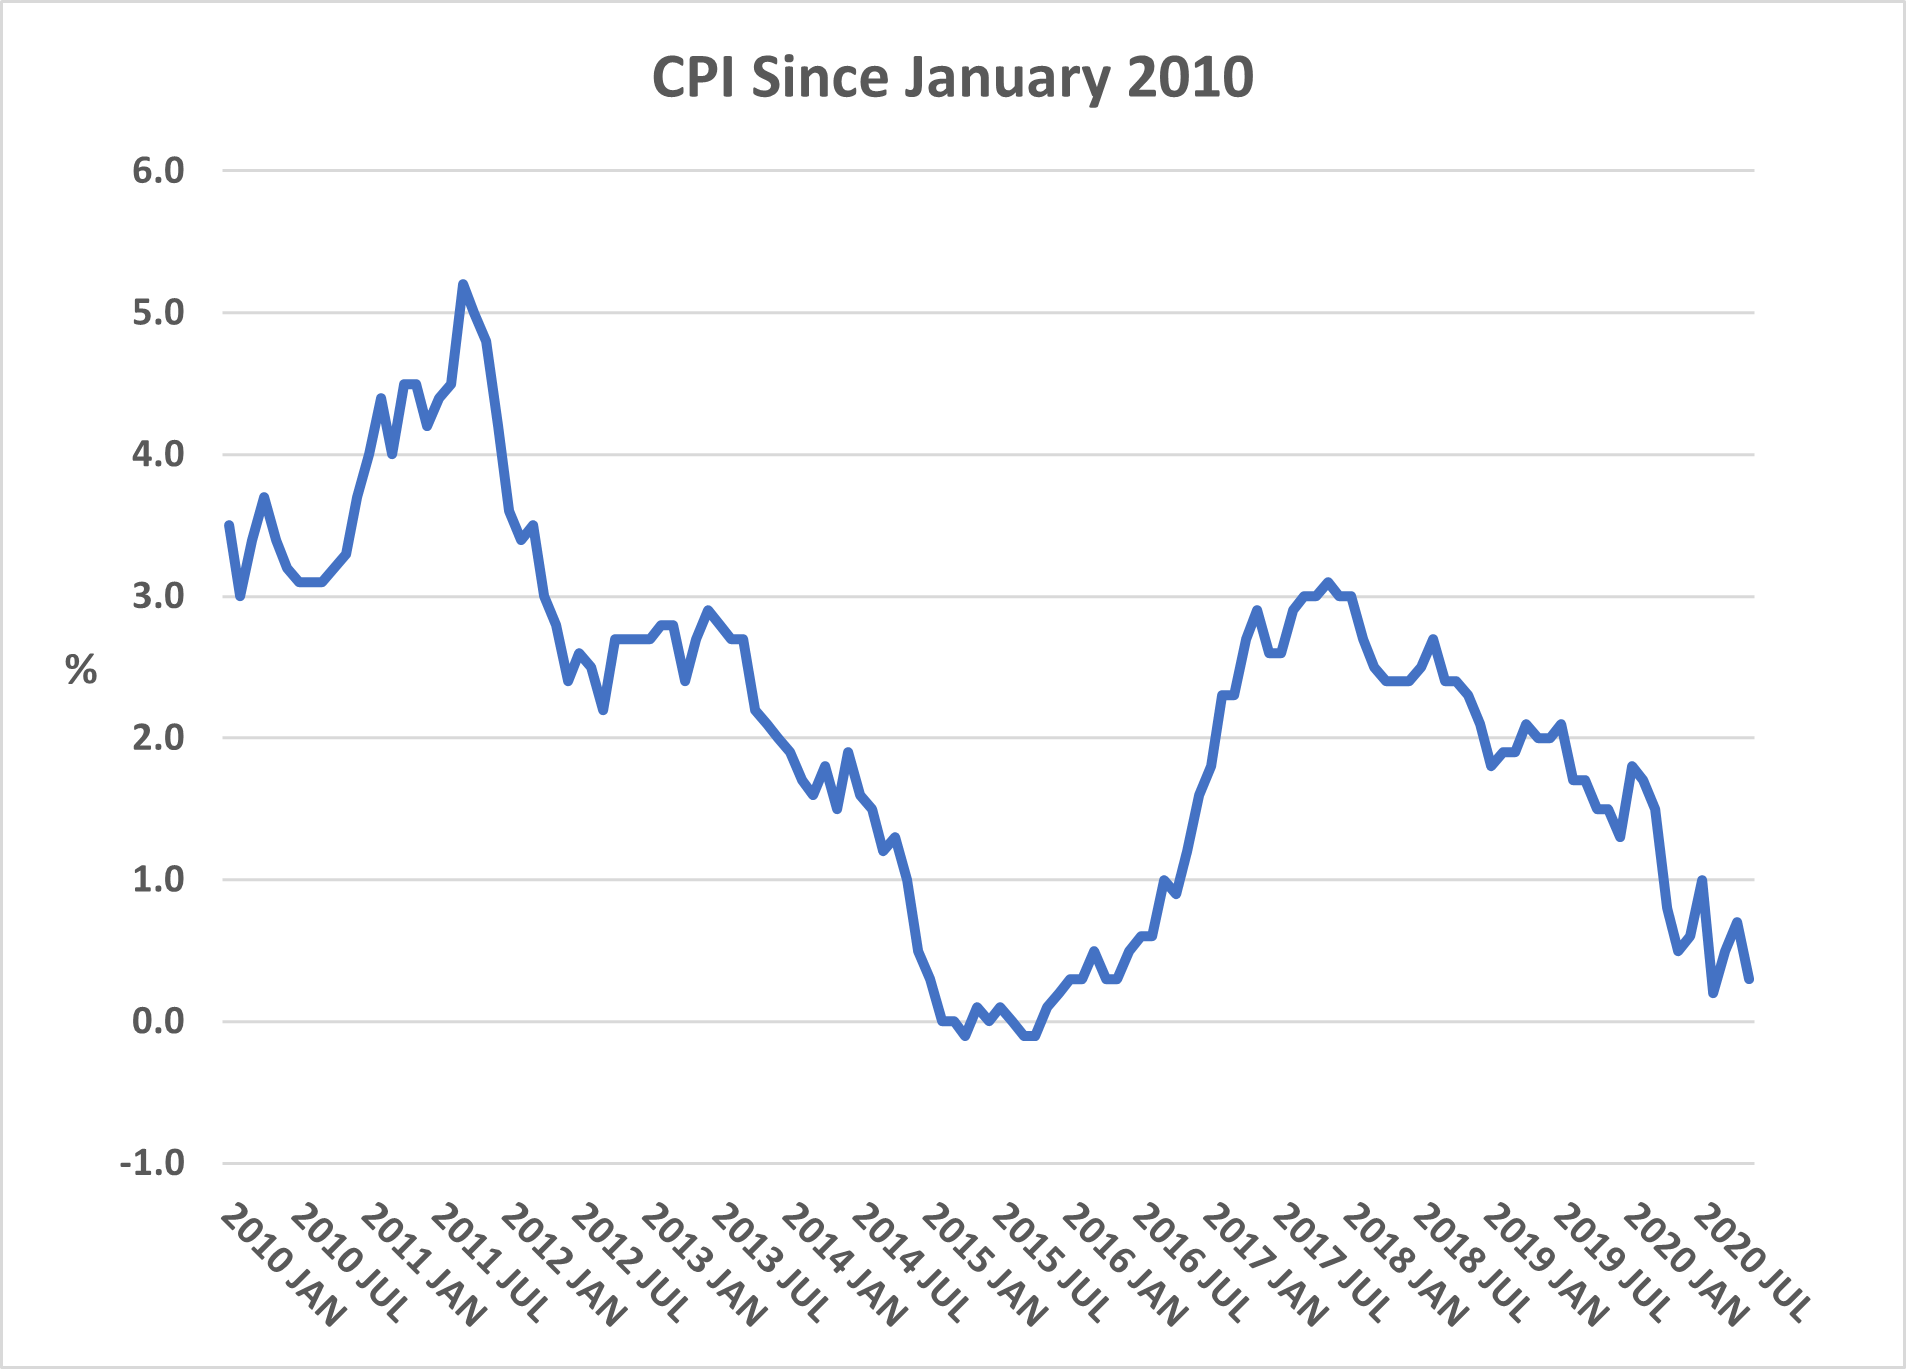
The CPI for November fell 0.4% to an annual rate of 0.3%, half of market expectations according to Reuters. Across October to November prices fell 0.2%, whereas they increased by 0.2% over the same period last year.
The CPI/RPI gap was unchanged at 0.6%, with the RPI annual rate dropping from 1.3% to 0.9%. Over the month, the RPI was down 0.3%.
The ONS’s favoured CPIH index (and, as we now know, the RPI from 2030) was also down 0.3% for the month to 0.6%.
As a result of the second rounds of lockdown, the number of items in the CPIH ‘shopping basket’ that were unavailable to consumers in the UK jumped from 8 (or 1.1% of the CPIH basket by weight) in October to 72 (13.9%) in November. The ONS says that it “collected a weighted total of 83.8% of comparable coverage collected before the previous lockdown”.
The ONS highlights the following as the more significant of the moves causing the fall in the CPIH inflation rate:
Downward
Clothing and footwear The largest downward contribution (0.2% to the CPIH) came from this category, which was the largest upward contributor in October. Overall prices fell by 2.6% between October and November 2020, compared with a rise of 1.0% between the same two months a year ago. The ONS says that while prices usually rise between these two months, “price movements across 2020 have been unusual compared with previous years and appear to have been affected by the coronavirus lockdowns”. It also says the drop reflects increased discounting around Black Friday sales.
Food and non-alcoholic beverages There was also a large downward contribution from food and non-alcoholic beverages, where prices fell by 0.2% between October and November this year, compared with a rise of 0.8% a year ago. The effect came from across a wide range of food and drink categories. For the CPI, this sector is now showing annual inflation of -0.6%.
Upward
Restaurants and hotels The largest upward contribution (matching the food and non-alcoholic beverages downward contribution) came from restaurants and hotels. Overall prices were estimated to have risen by 0.7% between October and November 2020, compared with a fall of 0.2% between the same two months a year ago. Note the use of the word ‘estimated’: lockdowns meant that where prices could not be assessed directly they were “imputed using the all-items CPI monthly and annual growth rates (for available items)”.
Eight of the twelve broad CPI groups saw annual inflation decrease, while two posted an increase and two were unchanged. The category with the highest inflation rate remains Communications at 3.5% (up from 3.3%).
Core CPI inflation (CPI excluding energy, food, alcohol and tobacco) fell by 0.4% to 1.1%. Goods inflation fell from 0.0% to -0.8%, while services inflation was unchanged at 1.4%.
Producer Price Inflation was -0.8 % on an annual basis, up from -1.4% in October on the output (factory gate) measure. Input price inflation rose to -0.5% from -1.2% year-on-year. The main driver here was, as usual, crude oil prices.
At times Black Friday felt like it was Black November and this appears to have caught out the economists expecting a higher inflation rate.
Source: ONS 16/12/2020
(AF4, FA7, LP2, RO2)
UK shares may have had a miserable 2020, but returns from UK bonds were comfortably in positive territory.
By the start of 2020 there had long been talk that the long bull run in bonds was due to end. Mark Carney was still at the Bank of England, speaking of gradual base rate increases. Quantitative easing (QE) looked to be at an end.
The year did not turn out as its start suggested. 2020 was another good 12 months for UK fixed interest investment, with sector average total returns for the Investment Association (IA)’s five main sterling bond categories between +12.2% (Index Linked Gilts) and +4.0% (Sterling High Yield). In contrast to 2019, returns on Government securities outpaced those of other fixed interest securities. No doubt a fresh £450bn of QE, almost entirely directed at gilts, was a help.
|
Bond/Index |
31/12/2019 Yield |
31/12/2020 Yield |
Yield Change |
|
2 year benchmark gilt |
0.53% |
-0.17% |
-0.70% |
|
5 year benchmark gilt |
0.60% |
-0.09% |
-0.69% |
|
10 year benchmark gilt |
0.82% |
0.19% |
-0.63% |
|
30 year benchmark gilt |
1.33% |
0.76% |
-0.57% |
|
2.5% Treas index-link 2024* |
-2.27% |
-2.83% |
-0.56% |
|
2% Treas index-link 2035* |
-2.10% |
-2.72% |
-0.62% |
|
Markit iBoxx gilts 10 year + |
1.23% |
0.65% |
-0.58% |
|
Markit iBoxx AA 10 year + |
1.26% |
0.66% |
-0.60% |
|
Markit iBoxx BBB 10 year + |
2.90% |
2.13% |
-0.77% |
|
Markit iBoxx Corporates 10 year |
2.55% |
1.79% |
-0.76% |
*Real yields
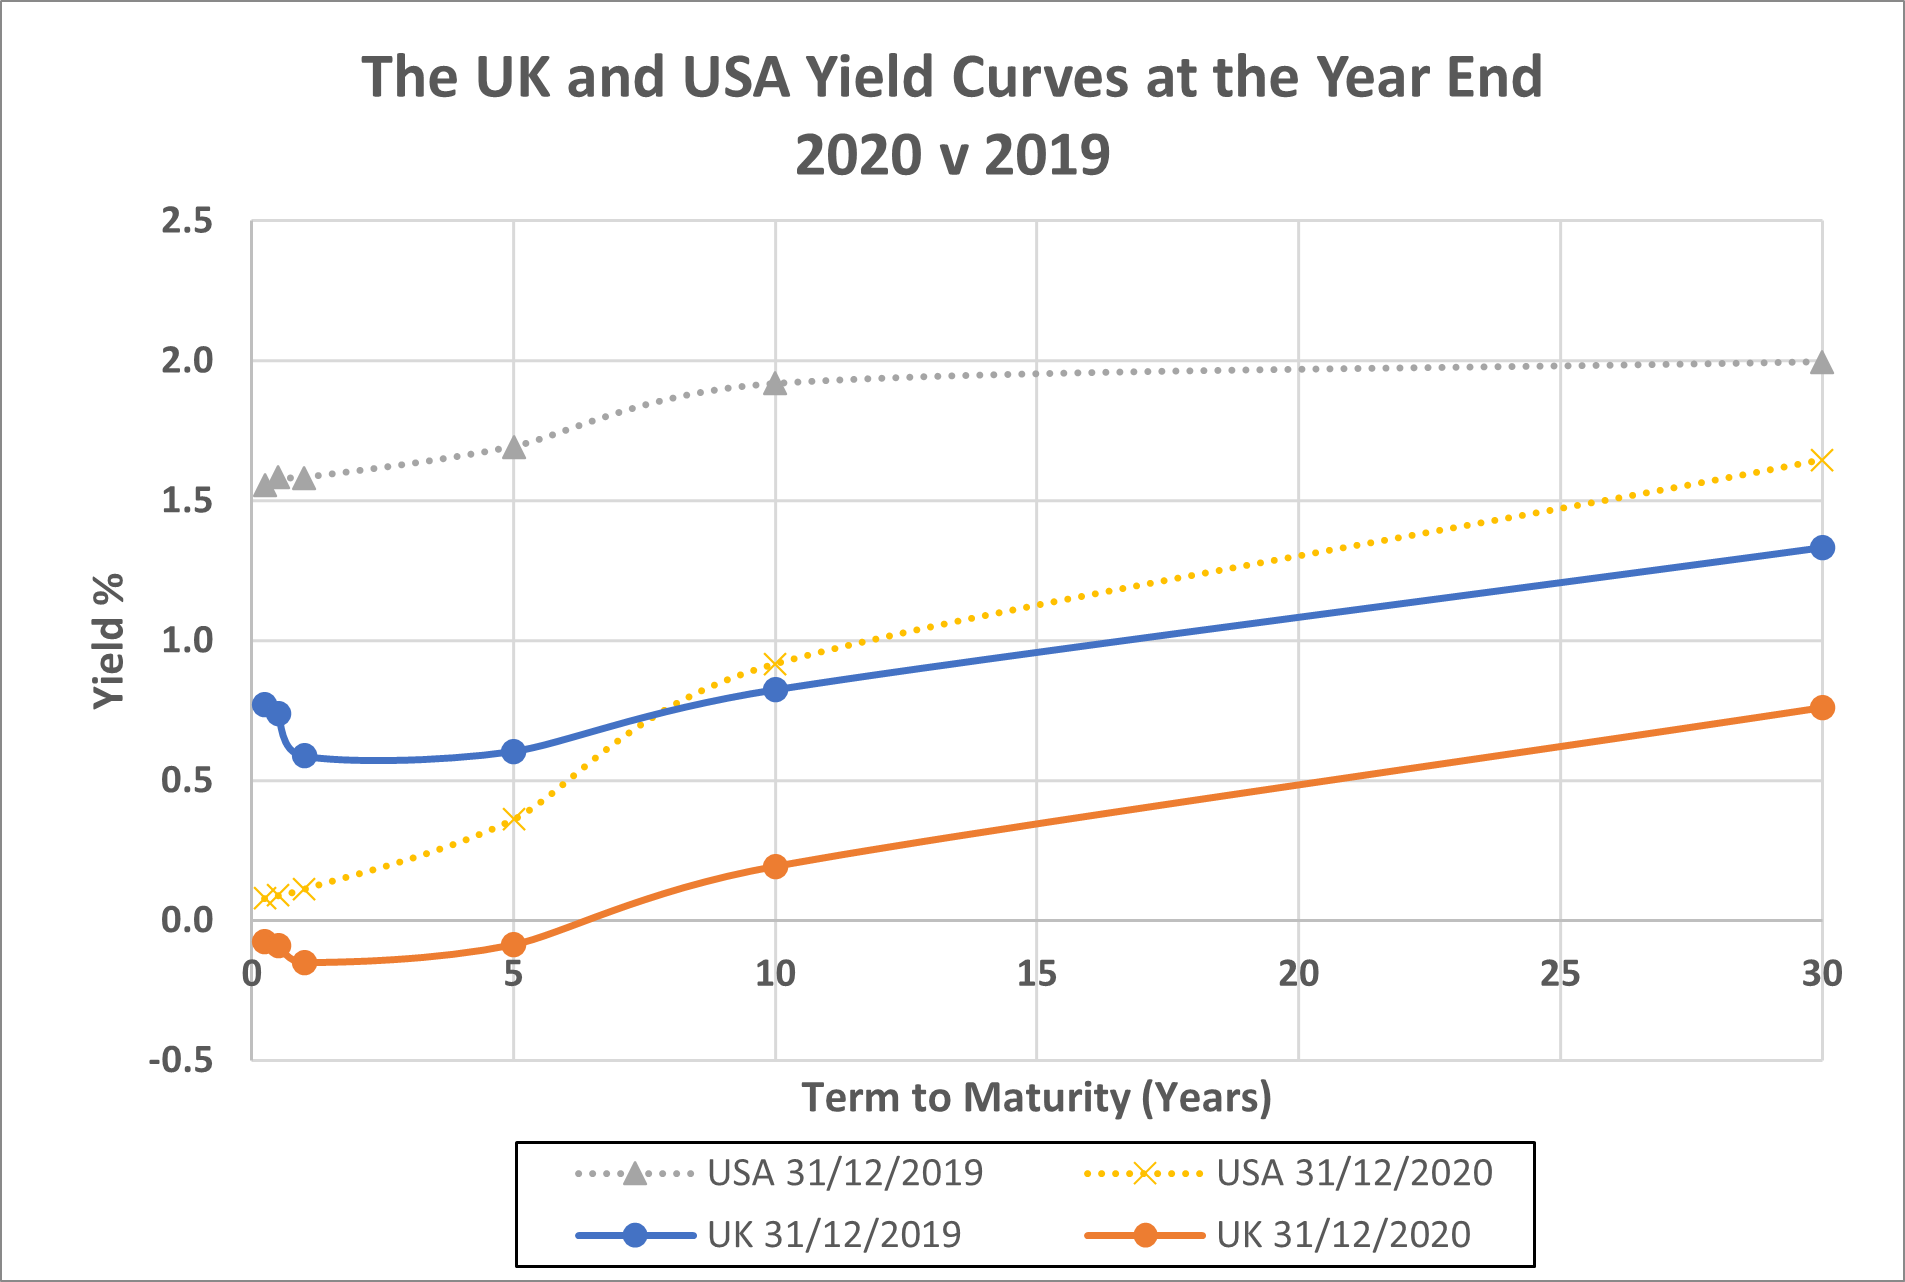
The table highlights three factors which were themes of the year:
- The base rate dropped from 0.75% to 0.1% in less than a fortnight in March and then remained there.
- The fall in gilt yields across the year was remarkably even, at around 0.6%. As a result, the shape of the yield curve was just about unchanged (see above).
- While the Bank of England kept talking about negative interest rates, the reality in the gilts market was that by the end of December negative yields stretched out to six years.
The performance of the various IA sterling fixed interest sectors over 2020 was:
|
IA Sector |
2020 Total Return |
|
UK Index-linked Gilts |
+12.2% |
|
UK Gilts |
+ 9.0% |
|
Sterling Corporate Bond |
+ 7.8% |
|
Sterling Strategic Bond |
+ 6.6% |
|
Sterling High Yield |
+ 4.0% |
Source: Trustnet
In the Eurozone, yields on many Government bonds spent the year in negative territory, although there was a bout of volatility in March which particularly hit the weaker EU economies. Over the year as a whole, bond rates were forced down by the European Central Bank’s expanded QE with a rebranding as the Pandemic Emergency Purchase Programme (PEPP). This started at €750bn, but by December 2020 PEPP had grown to have an ‘envelope’ of €1,850bn. Even Greece finished the year with its 5-year bond yielding less than 0.1%. However, the ECB made no official rate changes during 2020.
US yields fell across all durations during 2020, partly in response to the Federal Reserve’s two rate cuts totalling 1.5% in March. However, unlike the UK, US bond rate falls were biased towards the short term, steepening the yield curve. Thus 2-year Treasury benchmark yield dropped from 1.571% to 0.123% over the year, while the 10-year bond yield was down to 0.917% from a starting point of 1.919%. The 10-year US Treasury bond recorded a yield of just over 0.5% at the end of July, but has since steadily risen. Over the same period the 2-year bond yield is virtually unchanged.
As we said in the last year’s commentary, the 30 year plus bull market in bonds has continued to defy those who say that if it cannot go on forever, it must end. We also said a year ago that it was hard to envisage much more downward pressure on rates from the central banks, a comment which proved to be distinctly wrong. In 2021 the central banks will do everything not to raise rates, but if recovery falters there is even less left in the monetary armoury.
Source: Investing.com. Market.com 2/1/21
(AF4, FA7, LP2, RO2)
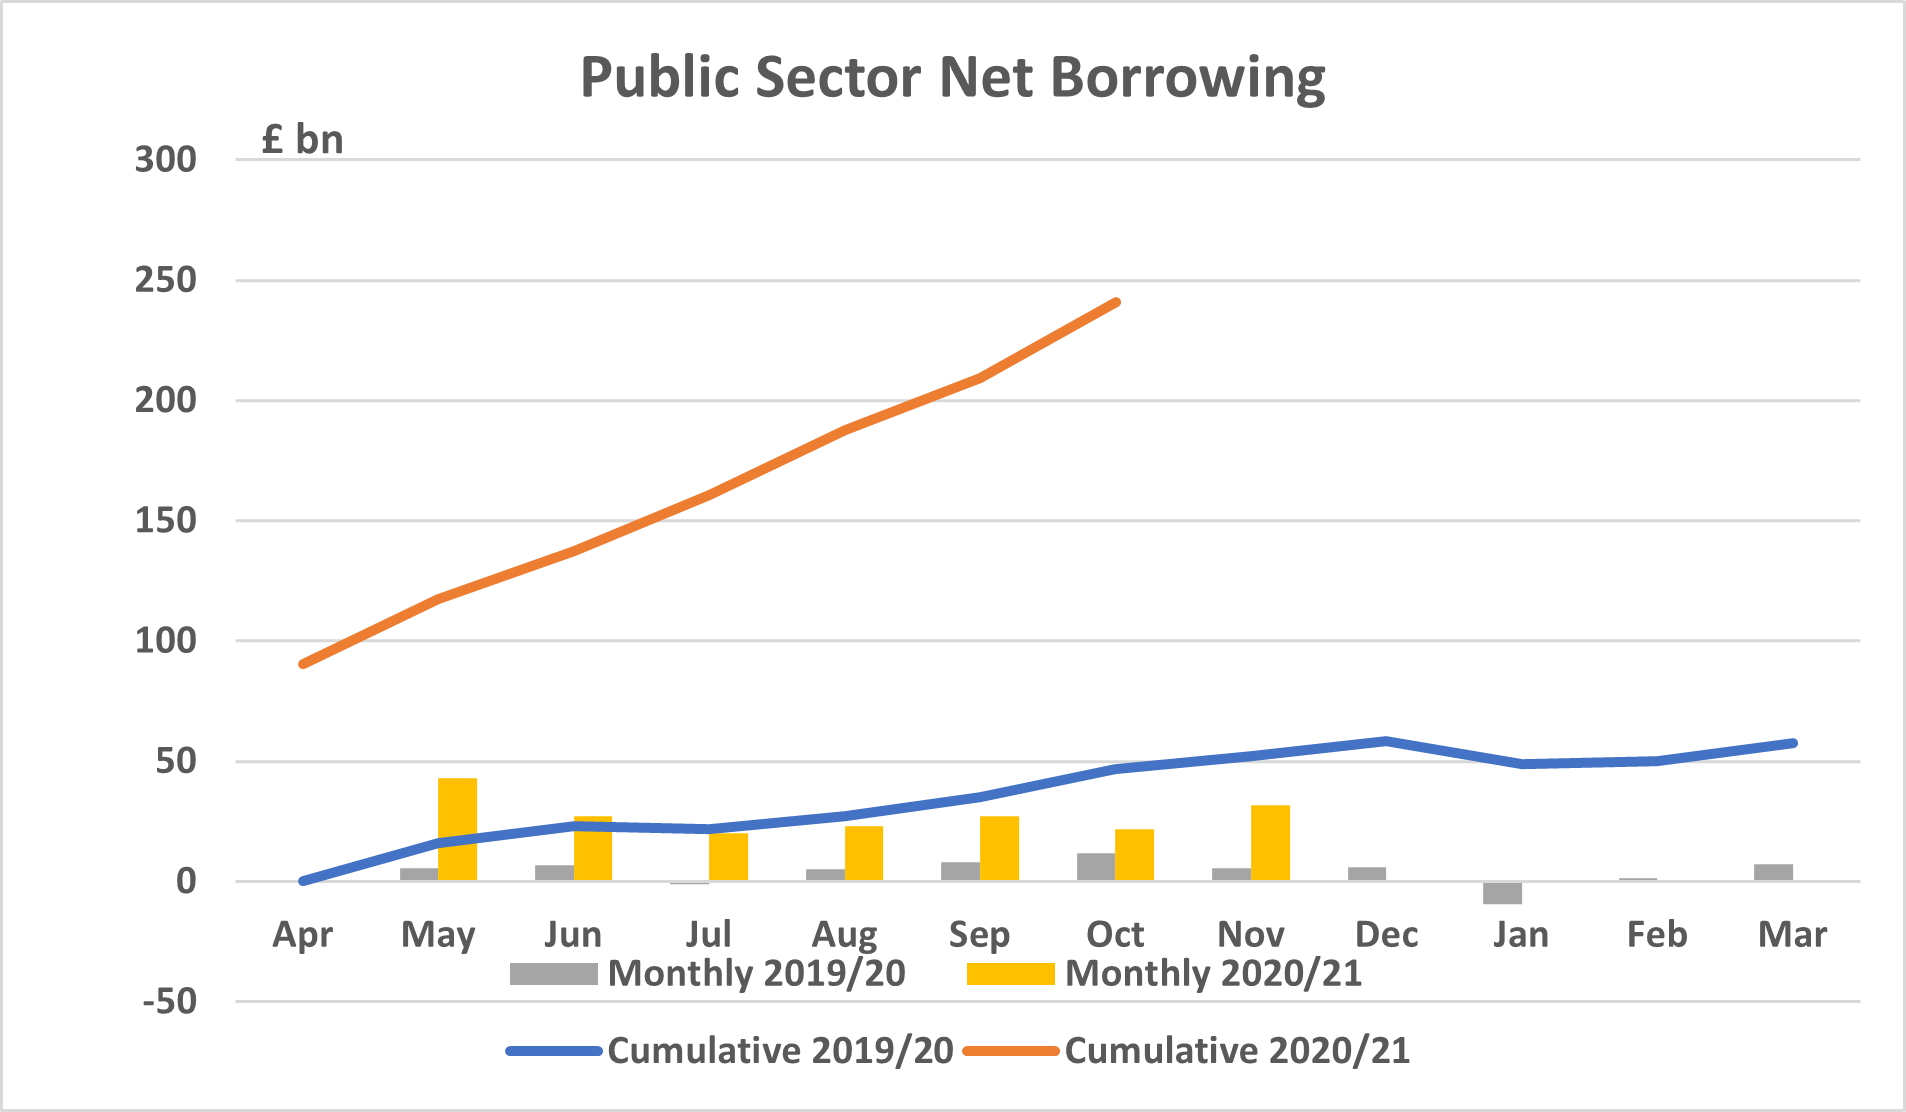
In November, Government borrowing increased sharply and set yet another new record, with debt reaching £2.1 trillion
Four days after the Chancellor announced a one month extension of the Coronavirus Job Retention Scheme (CJRS) scheme and two extra months for the loan schemes, the latest Public Sector Finances data were released by the Office for National Statistics (ONS). They help to explain why Mr Sunak has been gathering a reputation for deferring pandemic support extensions until the last moment:
- The public sector net borrowing requirement (PSNBR) in November 2020 is estimated to have been £31.6bn, £26.0bn more than a year ago. Unsurprisingly, that makes it the highest ever for November and, perhaps slightly less predictably, the third highest borrowing in any month since records started in 1993.
- For the first eight months of this financial year, total borrowing amounted to £240.9bn, £26.0bn above last month’s figure. The £5.6bn difference between the extra borrowing in November and the cumulative borrowing for the year to date is the consequence of more revisions to earlier months’ numbers by the ONS. Most of these were represented by lower than estimated central and local Government net borrowing, partially offset by higher public corporate borrowing.
Despite another set of downward revisions, the eight-month outturn was the highest borrowing for that period on record. In cash terms it was £188.6bn up on 2019/20.
- Overall Government debt rose to £2,099.8bn, £303.0bn (16.9%) higher than a year ago. As a percentage of UK GDP, debt was 99.5% in November, a fall reflecting the revised figures and the rolling adjustment to the GDP figure. Nevertheless, once the tweaks are considered, the figure is still the highest since 1961/62.
- After last month’s absence because of the November statement, the Office for Budget Responsibility (OBR) has produced its usual monthly commentary on these numbers, incorporating its revised forecasts. The OBR notes that the costs of the two extensions announced by the Chancellor “might be of the order of £3 billion for an additional month of CJRS claims and £4 billion for the upfront cost of future write-offs associated with two more months of loan outlays”. The expected write offs for loans made to date have still not reached the ONS figures. The OBR calculates that when they do, they will add another £29.5bn to the 2020/21 deficit.
- The lockstep march of gilt sales and quantitative easing (QE) continued in November. Over the eight months to date of 2020/21, gilt sales (net of redemptions) amounted to £304bn, while the Bank of England’s QE gilt purchases totalled £308bn.
The OBR’s November projection of £394 bn of borrowing in 2020/21 has already started to look outdated, given the latest lockdown measures. Interestingly, the OBR highlights that the ONS “is continuing to consider how to reflect non-payment of tax liabilities” in its data. The issue here is that the ONS uses accruals-based receipts figures and, as many landlords have discovered, theoretical accruals and actual receipts can differ significantly.
Source: ONS 21/12/20 OBR 21/12/20
A poor year for UK shares…but it could have been worse
(AF4, FA7, LP2, RO2)
The FTSE 100 ended the year down 14.3%, making the UK one of the poorest performing global markets in 2020.
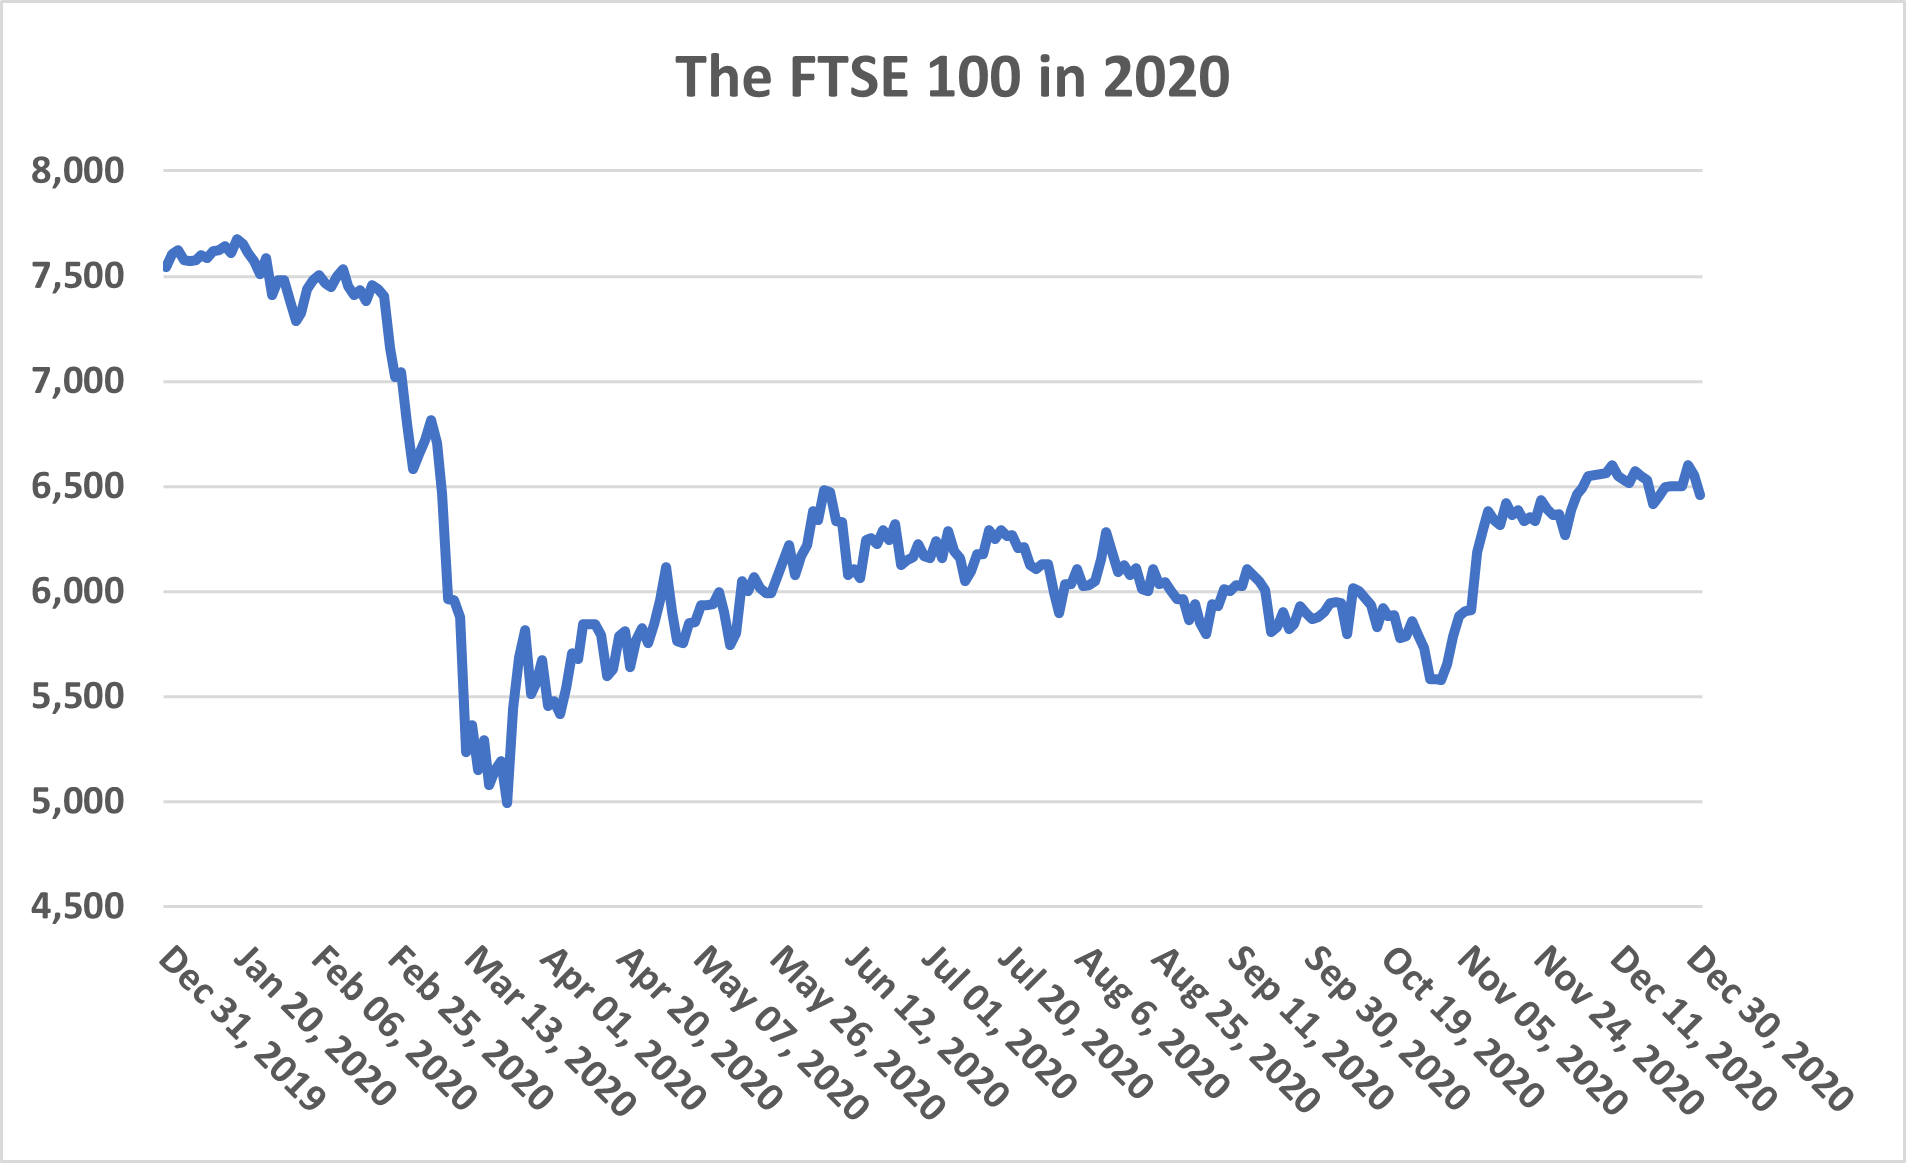
The FTSE 100 ended 2020 down 14.3%, more than cancelling out the 12.3% rise in 2019. However, it could have been much worse. By 23 March, the day lockdown officially started, the Footsie had fallen 33.8% to 4,993.89. Anyone brave enough to invest then would have seen a 29.4% gain by the year end – healthy enough, but less than half the bounce back (and beyond) recorded by the S&P 500 between the same two dates (67.9%).
In 2020 the FTSE 100 was again substantially outperformed by its FTSE 250 counterpart. This was largely down to the heavy weighting of oil companies and banks in the main index, two sectors that were seriously out of favour (and slashing or, in the case of banks, stopping dividend payments). The table below summarises the movements of the main FTSE indices.
|
Index |
2020 Change |
Comment |
|
FTSE 100 |
-14.3% |
Pandemic hit and partial recovery |
|
FTSE 250 |
-6.4% |
Less exposed to hard hit sectors |
|
FTSE Small Cap |
+4.5% |
Looking to recovery and growth |
|
FTSE 350 Higher Yield |
-20.8% |
Another bad year for value-investing |
|
FTSE 350 Lower Yield |
-4.9% |
Growth thumps value as a strategy again |
|
FTSE All-Share |
-12.5% |
Outperformed Footsie due to mid and small caps |
|
FTSE Basic Materials |
+13.0% |
Top ICB sector, boosted by mining companies |
|
FTSE Oil and Gas |
-43.7% |
Bottom ICB sector: BP, Shell slash dividends |
Over the year, the dividend yield on the FTSE All-Share Index fell from 4.46% to 3.44%, despite the decline in the value of the Index. Work backwards and the implication is that dividends contracted by 32.5%. The shrinkage is better than the dire year-on-year results shown by Link Asset Services in the first half of 2020. In retrospect, some companies were probably too eager to cut or stop dividend payments. Others grabbed a golden opportunity to ‘rebase’ unrealistic pay out levels. Perhaps surprisingly, dividend cover rose over the year, albeit only from 1.39 to 1.45, on the FTSE All-Share.
The performance of the UK equity market was below the global average, even after adjusting for currency effects. In sterling terms, the MSCI ACWI was up 10.8%. That worldwide performance was helped by the strong US market (about 58% of the index): the MSCI ACWI ex USA recorded a more modest rise of 4.9%.
In the emerging markets, returns were mixed, with Asian strength more than countering weakness elsewhere. The MSCI Emerging Markets Index was up 12.3% in sterling terms (against an 11.0% rise in 2019). China, as measured by the Shanghai Composite, was up 13.9% over 2020.
It was a highly volatile year for the UK and other global markets. The rally from the March lows and the November boost from vaccine news were both reminders that markets are forward looking. Both moves also underlined the near impossibility of market timing. 2021 will be a test of whether the market’s vision of the post pandemic era and its imminent arrival prove correct.
Source: Investing.com and the Financial Times 4 January 2021
More articles like this are available through Techlink. Techlink delivers an extensive technical library of executive summaries, daily bulletins and accredited CPD. You can access a free trial of Techlink at https://www.techlink.co.uk/public/subscription/ [eur02.safelinks.protection.outlook.com]. If you subsequently sign up to Techlink use the PFS code ‘PFS21’ to receive a discount to the normal subscription rate.
This document is believed to be accurate but is not intended as a basis of knowledge upon which advice can be given. Neither the author (personal or corporate), the CII group, local institute or Society, or any of the officers or employees of those organisations accept any responsibility for any loss occasioned to any person acting or refraining from action as a result of the data or opinions included in this material. Opinions expressed are those of the author or authors and not necessarily those of the CII group, local institutes, or Societies.