Investment planning; global dividend payments, RPI Calculation and more.
Technical article
Publication date:
15 December 2020
Last updated:
19 February 2026
Author(s):
Technical Connection
Investment planning update from 26 November 2020 to 9 December 2020
- The fall in global dividend payments is easing
- RPI Calculation basis to change in 2030
- A bumper month – Market update
The fall in global dividend payments is easing
(AF4, FA7, LP2, RO2)
The latest Janus Henderson Global Dividend Index shows dividends still dropping in the third quarter, but by about 8% less than in the previous quarter.
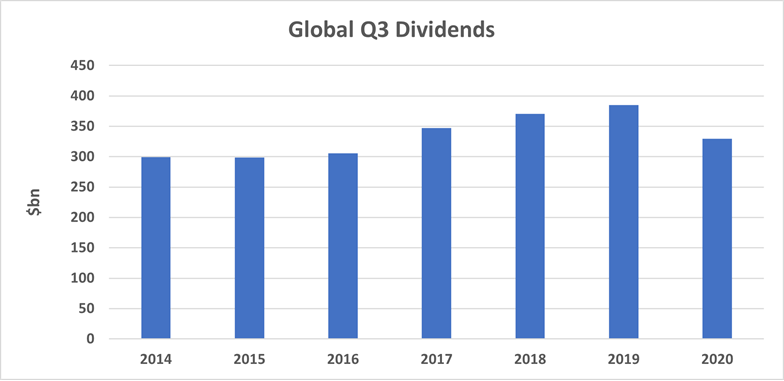
Last month we noted that Link Asset Services’ Q3 Dividend Monitor showed UK dividends falling by a headline rate of 49.1% year-on-year. It was at least an improvement on the 57.2% of Q2. The latest Janus Henderson Global Dividend Index shows a similar improvement, although global dividends have not fallen anywhere near as much as in the UK:
- Global dividends paid in Q3 2020 were 14.3% less than for the corresponding period in 2019. If special dividends are excluded, the decline in regular dividends is 11.4%. In hard cash terms, investors received a reduction of $55bn in their Q3 income.
- The UK remained the region with the steepest fall (47.0% in US$ terms according to Janus Henderson), followed by Europe ex UK at 25.0%, Asia Pacific ex-Japan at 20.1%, Japan at 16.5%, North America at 4.7% and Emerging Markets at just 2.3%.
- In country terms, Australia pipped the UK to bottom slot with a drop of 47.8%, hit by falls in special dividends and bank payouts. Dividends from Asia Pacific ex-Japan would have been flat year-on-year were it not for Oz.
- The relatively good performance of Emerging Markets was helped by China, where dividend payments ($30bn in Q3 2020) are concentrated in the third quarter of the year. Year-on-year Chinese dividends rose by 3.3% in US$ terms. However, as Janus Henderson notes, these dividends mainly reflect 2019 profits, so it will not be until next year that the impact of the global recession feeds through.
- Janus Henderson considers that the worst of the cuts are now behind us but does not expect growth to return until the anniversary of the first global lockdown has passed at the end of Q1 2021. For 2020 as a whole, they now estimate the range of overall cuts as being between 17.5% and 20.2%.
Despite the depressing numbers for Q3, Janus Henderson see underlying (regular) global dividends as, at worst, being flat across 2021 and, at best, up 12%.
Source: Janus Henderson November 2020
RPI Calculation basis to change in 2030
(AF4, FA7, LP2, RO2)
The Chancellor has confirmed changes to the basis of the RPI calculations will take effect from February 2030.
Partially lost in all the other announcements made on 25 November was a paper from the Treasury revealing a decision on the long-running topic of replacing the Retail Prices Index (RPI) with the Consumer Prices Index (CPI) including owner-occupied housing costs (CPIH). The RPI has not been an official National Statistic since 2013 because of serious drawbacks in its method of calculation, which date back to the 1950s.
In March 2019, the UK Statistics Authority (UKSA) made a series of recommendations to the then Chancellor to reform the RPI, which eventually resulted in a consultation paper from the Treasury being issued a year (and two Chancellors) later. It is the response to that consultation that was published on 25 November.
The decision made by the Chancellor was to change the calculation basis of the RPI to match that of the CPIH from February 2030 – a sort of rebranding of CPIH. The transition will take a year to complete, as each month the RPI monthly data from a year ago drops out and is replaced by a month’s CPIH data.
The choice of 2030 is driven by the fact that two index-linked gilts issued long ago (Treasury 2½% Index-linked 2024 and Treasury 41/8% Index-linked 2030) have terms which protect their investors from a ‘materially detrimental’ change to the RPI. The terms of more recently issued gilts do not have such a clause, allowing the Treasury to say their holders will not receive any compensation for the RPI basis change.
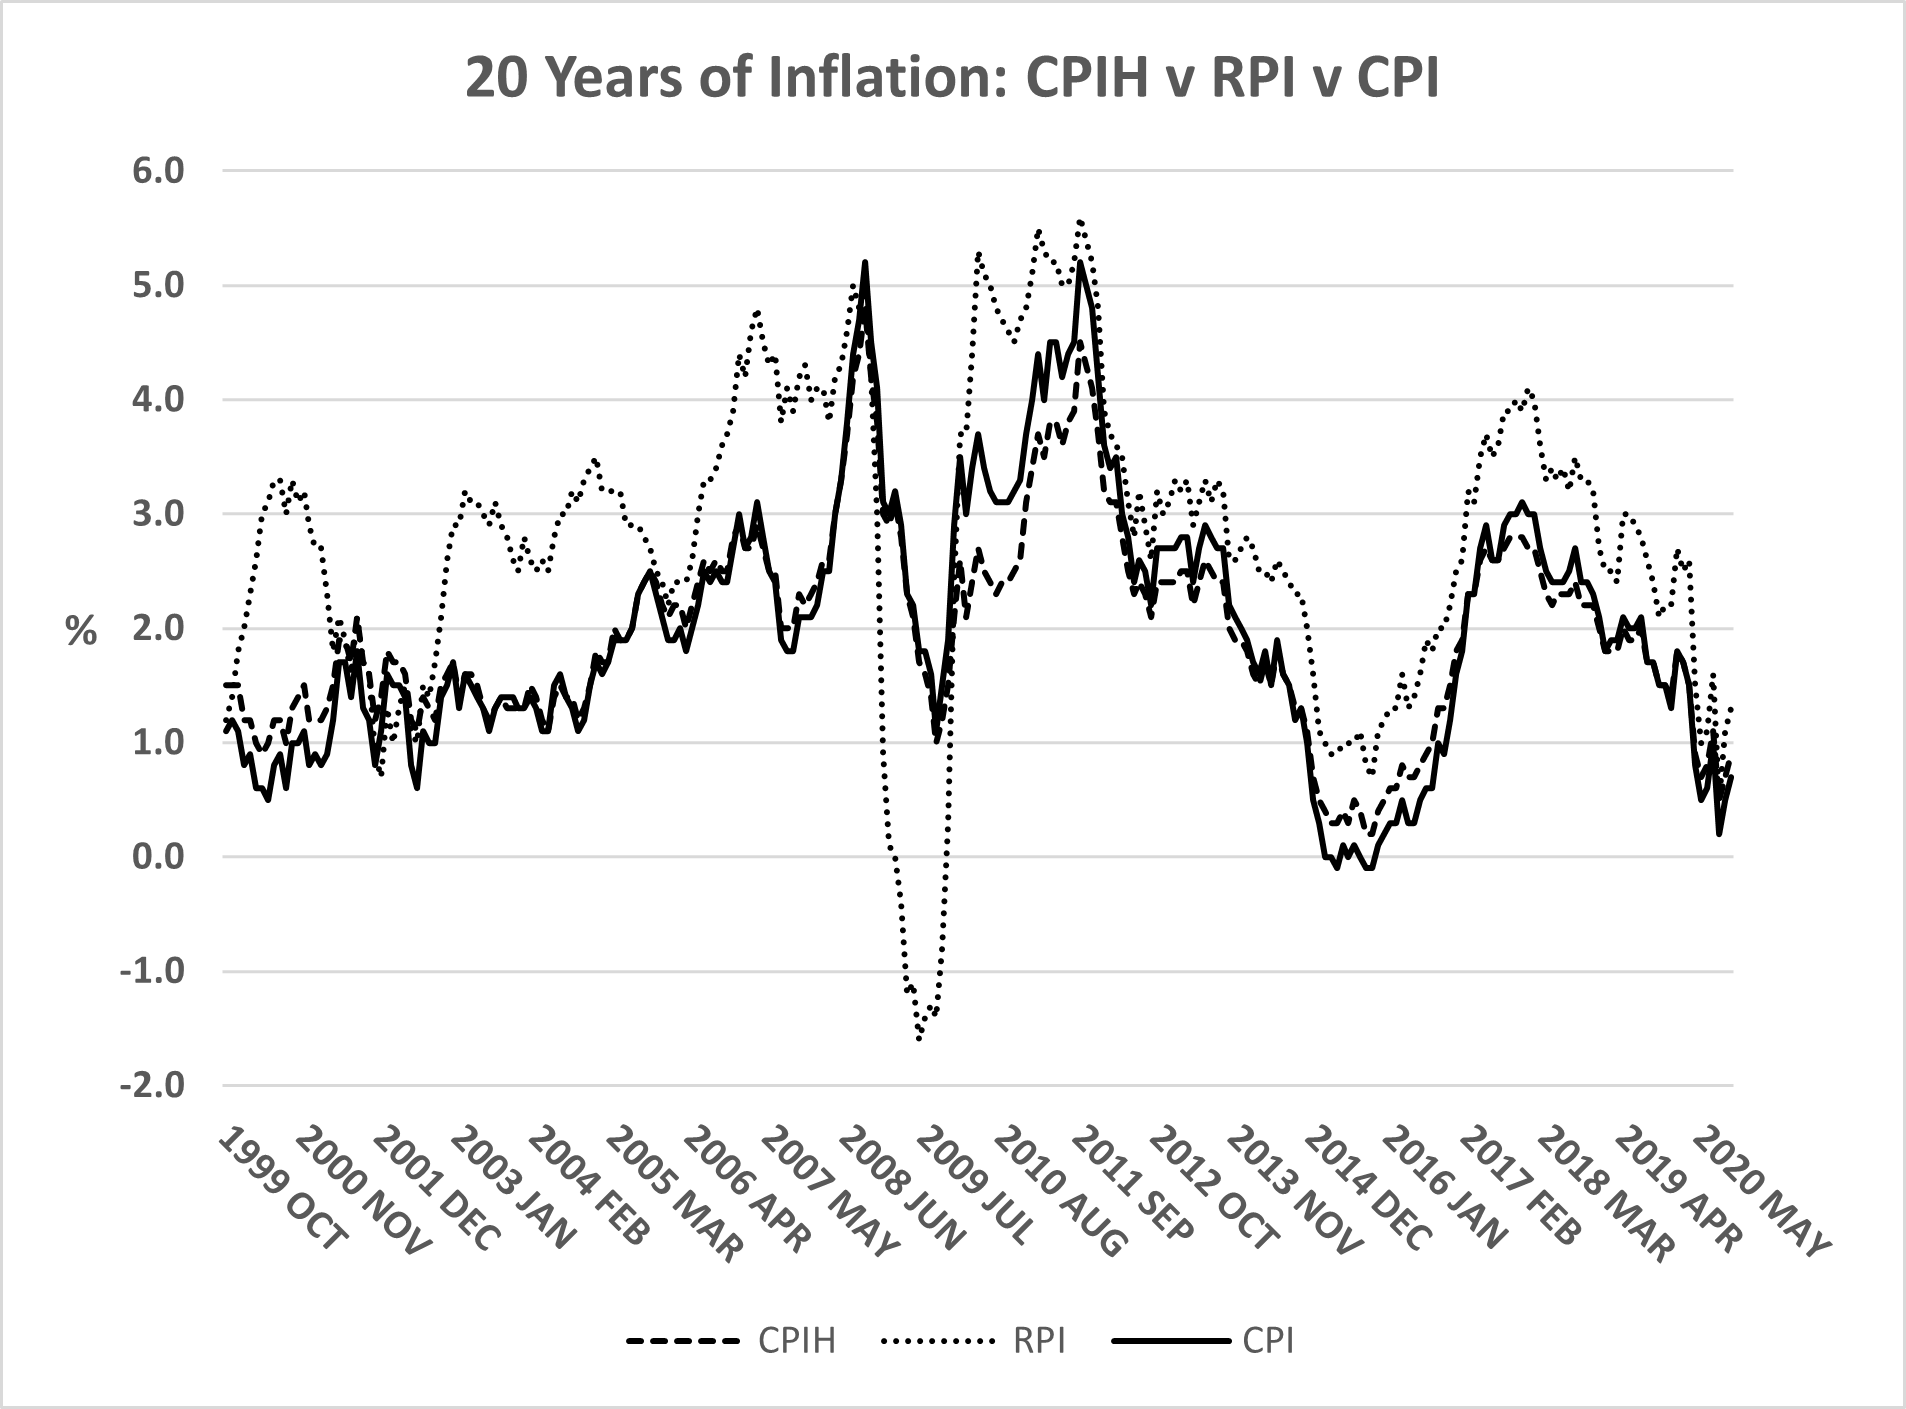
Those uncompensated investors will lose out from 2030 onwards because their bonds’ income and redemption values will reflect CPIH inflation which has generally been lower than (incorrectly calculated) RPI inflation. Over the last 20 years, the gap between the two has averaged 0.9% a year (2.9% v 2.0%), albeit with some wide fluctuations caused by drops in mortgage interest rates during the financial crisis (see graph below). For the record, CPI across the same period was 2.1%: as the graph shows, CPI and CPIH are normally close together.
The Treasury’s latest paper notes that the change will have a range of consequences, as well as leaving index-linked gilt investors worse off beyond 2030:
- Private sector defined benefit (DB) pension schemes will be affected, but the impact will be very much scheme specific. Worst hit will be those schemes that hold index-linked gilts or other RPI-linked investments to match pension liabilities (in deferment and payment) that are subject to CPI-linked increases. The move to CPIH from 2030 means that the discounted value of those schemes’ assets has been reduced with no corresponding reduction in their liabilities. Thus, their funding position will worsen. At the opposite end of the spectrum, schemes that hold matching index-linked gilts against benefits using RPI for revaluation and pension increases will effectively see no change. In theory, the move to CPIH will reduce both sides of the balance sheet equally. In between, but still on the losing side, are schemes that use a mix of CPI and RPI – typically CPI for revaluation, but RPI for in payment increases.
Data in a recent PPI report showed that 34% of private sector DB schemes used RPI for revaluation in deferral, but the proportion rose to 64% for pension-in-payment increases. The Pensions and Lifetime Savings Association (PLSA) calculates the overall hit to the value of pension scheme investments will be £60bn. The PLSA says the move ‘…will also raise the risk of insolvency for employers as they seek to address the shortfall in funding’.
- A corollary on the DB pension front is that DB scheme members will be worse off to the extent that their benefit revaluation and/or pension increases are RPI-linked. This has prompted some of the more dramatic headlines which just serve to underline the little appreciated power of compound interest. While a CPIH/RPI gap of 0.9% a year might not sound much, its cumulative effect can surprise: taking the last 20 years again, an RPI-linked pension would have risen by 76.8%, while its CPIH counterpart would have increased by 50.0% - more than a third less.
- In theory DB transfer values should fall because the value of the liabilities will drop. It will be interesting to see whether this happens in practice, and, if so, how quickly. The move from RPI to CPIH has been known about for over a year – the UKSA first recommended the switch in March 2019 and the then Chancellor initially floated a 2025-2030 timing range six months later. The gilts market has had time to adjust, and, since Mr Sunak’s 2030 confirmation, index-linked gilt prices have risen. Thus, while many DB schemes will have seen a fall in their technical liabilities, the market value of their assets has not followed.
- Outside of pensions, the RPI is used in a variety of areas. One of the more important is that it is the base rate for calculating interest on student loans, the maximum rate currently being RPI+3%. RPI is also used in calculating rail fare increases. In both instances, after 2030 the Government could simply add an extra margin – say 1% - to compensate for the lower rate of increase.
One interesting aspect of the change which has drawn little attention is the intergenerational transfer of wealth that the RPI/CPIH move represents. The older section of the population, with RPI linked pension benefits from DB pension schemes, will be worse off while the younger generations will have less of a Government bond interest burden to meet.
Source: HM Treasury Consultation outcome: A consultation on the Reform to Retail Prices Index (RPI) Methodology – dated 25/11/2020.
A bumper month – Market update
(AF4, FA7, LP2, RO2)
November was one of the best months ever for global equity markets.
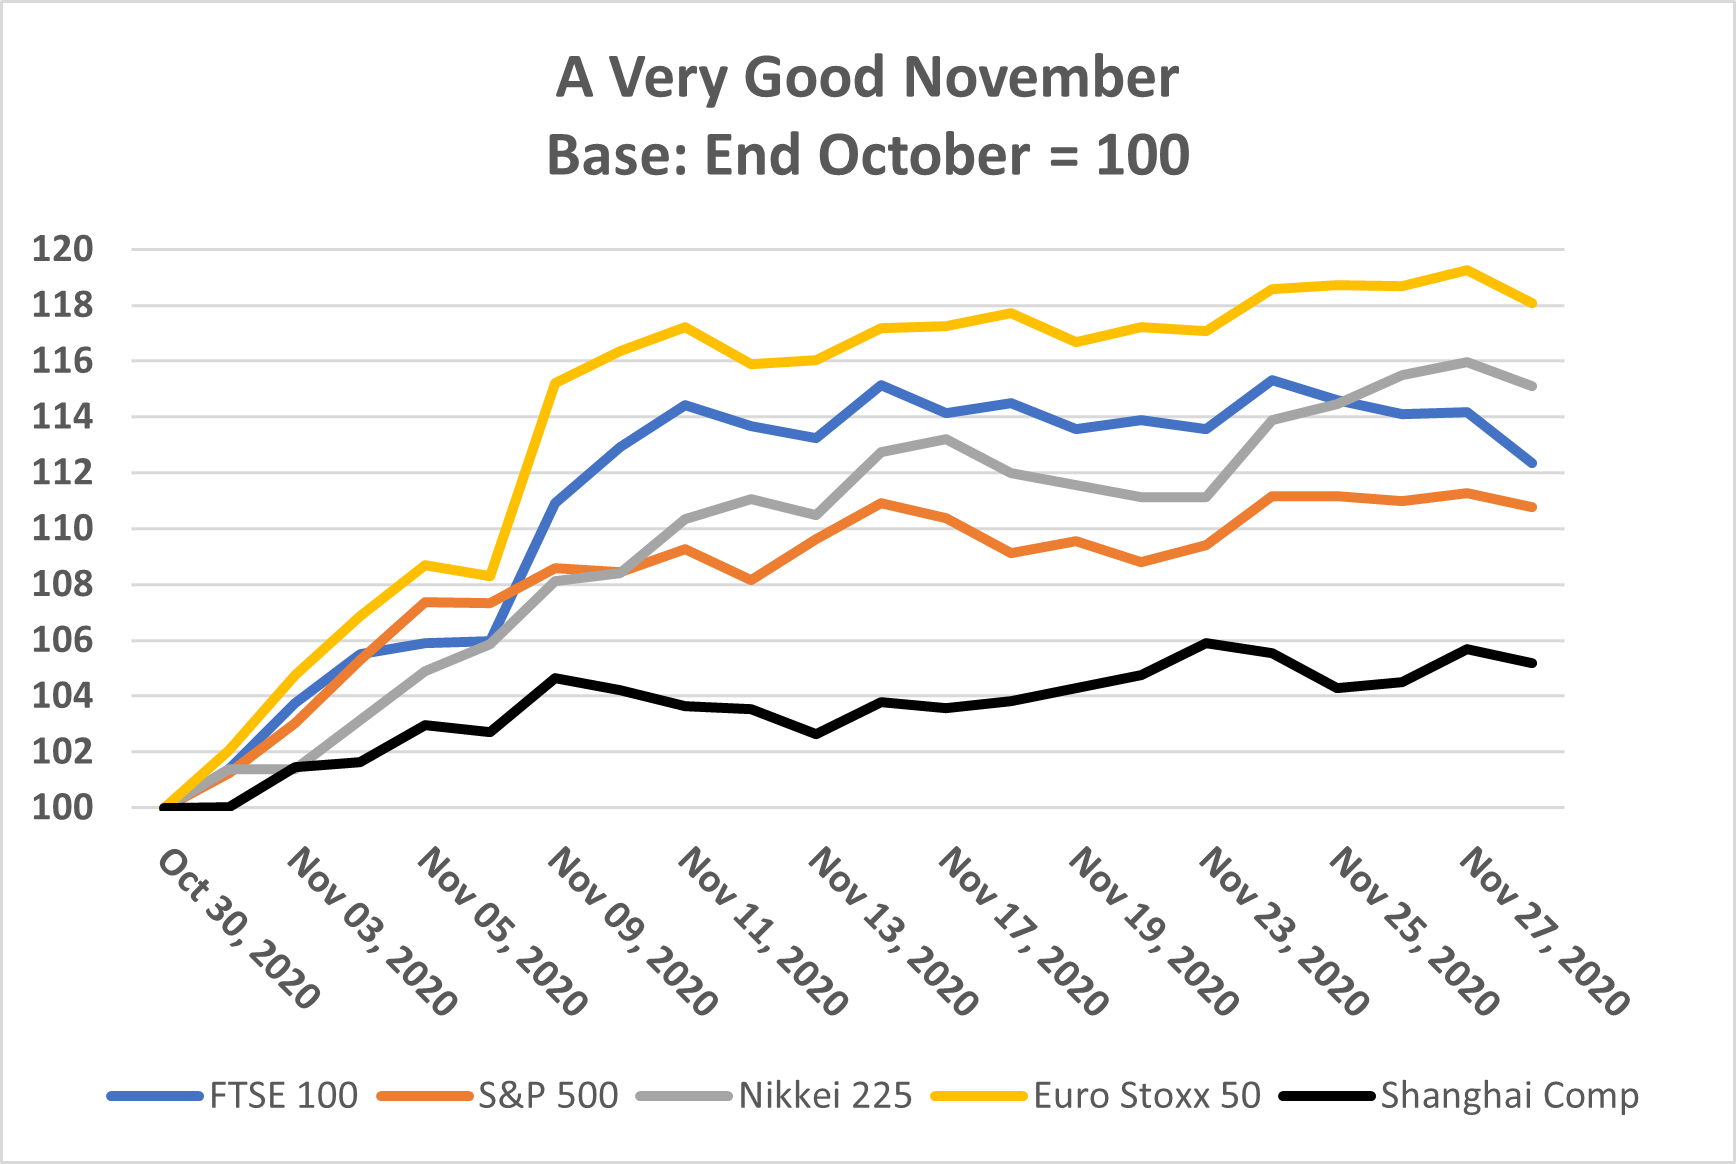
Last month we looked at the miserable final week of October on world markets, which we compared with the time in February when global equity markets were heading downwards almost as fast as the pandemic case numbers were moving in the opposite direction. We remarked at the time that for once the UK was not at the bottom of the league table: the FTSE 100 dropped 4.83% in the final October week, while the S&P 500 lost 5.64%. and the Euro Stoxx 50 declined by 7.52%.
After highlighting the gloom, it is only fair that we record the whiplash that happened in the month of November. Over that period the FTSE 100 jumped 12.4%, the S&P 500 gained 10.8%, and the Euro Stoxx 50 added 18.1%. It was the best one-month performance of the Footsie since January 1989 and the best monthly performance of the S&P 500 since January 1987. Ironically the Shanghai Composite, which had been one of the strongest performers earlier in the year, had a relatively modest November in such rocketing company – up just 5.2%.
What changed from the end of October were two things:
- The USA presidential election ended with a clear result (perhaps even for The Donald). The market’s worst fears were not realised. Having initially disliked the idea, markets also seem to have flipped on their attitude to the mix of a Democratic president up against a (likely, depending upon the Georgia run-offs) Republican Senate. In October that was viewed as a potential unwelcome deadlock, whereas now it has the appearance of maintaining the status quo.
- The news of vaccine trials, which came in after the November 3 election, gave markets a further boost as it offered the hope of a return to something nearer ‘normal’ in 2021.
From time to time, investment houses highlight how being out of the market for just a few days can mean missing out on substantial amounts of overall investment returns. November 2020 is set to be added to those don’t-try-investment-timing examples in the future.
Source: Investing.com
This document is believed to be accurate but is not intended as a basis of knowledge upon which advice can be given. Neither the author (personal or corporate), the CII group, local institute or Society, or any of the officers or employees of those organisations accept any responsibility for any loss occasioned to any person acting or refraining from action as a result of the data or opinions included in this material. Opinions expressed are those of the author or authors and not necessarily those of the CII group, local institutes, or Societies.