Investment planning update: ISAs; and Second quarter bounce
Technical article
Publication date:
15 July 2020
Last updated:
18 December 2023
Author(s):
Technical Connection
Update from 25 June 2020 to 8 July 2020
Investment planning
Latest ISA statistics now available
(AF4, FA7, LP2, RO2)
HMRC has recently published the latest Individual Savings Account (ISA) statistics.
The figures show that the number of investors subscribing to stocks and shares ISAs in the 2018-19 tax year fell by 450,000 from 2017-18, while those subscribing to cash ISAs subscriptions increased by 1.4 million. The share of accounts subscribed to in cash has increased to 76% of accounts, compared to 70% in 2017-18.
Overall, adult ISA subscriptions rose to 11.2 million in 2018-19 from 10.1 million in 2017-18.
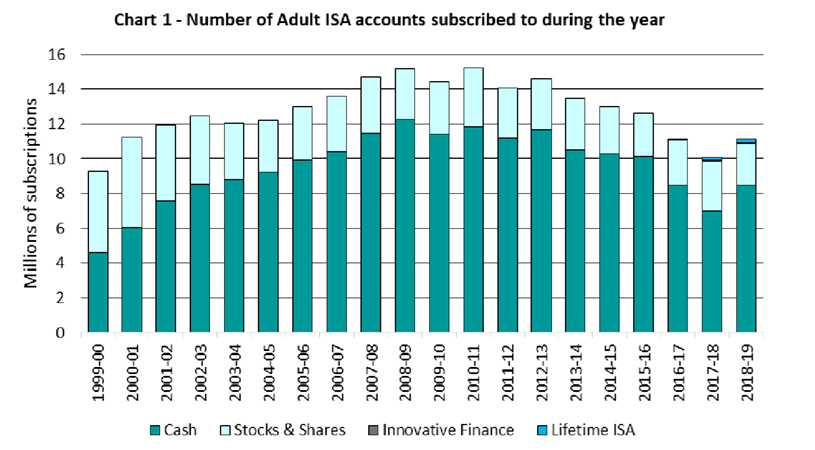
According to the figures, around £67.5 billion was subscribed to adult ISAs in 2018-19, which is an increase of £2.3 billion from 2017-18. This appears to have been due to a rise in cash ISA subscriptions – these rose by around £7.3 billion.
However, the amount subscribed to stocks and shares ISAs dropped by £5.2 billion compared with 2017-18.
With regard to Junior ISAs, around 954,000 Junior ISA accounts were subscribed to in 2018-19, which is an increase from 907,000 in 2017-18.
The average amount subscribed to a junior stocks and shares ISA was £1,465 and £830 in a junior cash ISA.
Source: https://www.gov.uk/government/statistics/individual-savings-account-statistics
(AF4, FA7, LP2, RO2)
The second quarter of 2020 has finished. You could be forgiven for thinking that the most hated bull market of all time had resumed.
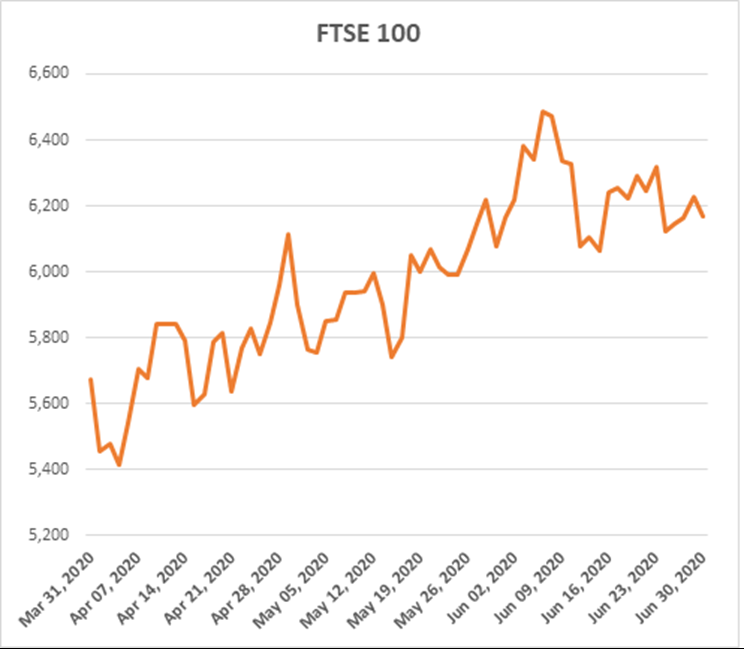
The first quarter of 2020, or more accurately the second half of the first quarter, was a turbulent time for investors. The second quarter has seen a strong bounce back, as the table below shows:
|
31/03/2020 |
30/06/2020 |
Change in Q2 |
|
|
FTSE 100 |
5671.96 |
6169.74 |
8.78% |
|
FTSE 250 |
15101.13 |
17119.16 |
13.36% |
|
FTSE 350 Higher Yield |
2622.71 |
2725.93 |
3.94% |
|
FTSE 350 Lower Yield |
3451.61 |
3962.87 |
14.81% |
|
FTSE All-Share |
3107.42 |
3410.93 |
9.77% |
|
S&P 500 |
2545.28 |
3100.29 |
21.81% |
|
Euro Stoxx 50 (€) |
2786.9 |
3232.85 |
16.00% |
|
Nikkei 225 |
18917.01 |
22288.14 |
17.82% |
|
Shanghai Composite |
2750.3 |
2984.67 |
8.52% |
|
MSCI Em Markets (£) |
1280.453 |
1506.832 |
17.68% |
|
UK Bank base rate |
0.10% |
0.10% |
0.00% |
|
US Fed funds rate |
0.0%-0.25% |
0.0%-0.25% |
|
|
ECB base rate |
0.00% |
0.00% |
|
|
2 yr UK Gilt yield |
0.11% |
-0.09% |
|
|
10 yr UK Gilt yield |
0.37% |
0.17% |
|
|
2 yr US T-bond yield |
0.24% |
0.16% |
|
|
10 yr US T-bond yield |
0.67% |
0.66% |
|
|
2 yr German Bund Yield |
-0.73% |
-0.71% |
|
|
10 yr German Bund Yield |
-0.55% |
-0.54% |
|
|
£/$ |
1.24 |
1.2356 |
-0.35% |
|
£/€ |
1.1301 |
1.1001 |
-2.65% |
|
£/¥ |
133.8595 |
133.3033 |
-0.42% |
There are a few points to pick out from the rosy picture of Q2:
- Markets are still down from the start of the year. There is an easy mathematical error to slip into here as a market that has suffered a 20% fall needs a 25% rise to get back to square one. The S&P 500 gives a good example: it fell by 21.2% in the first quarter, but the 21.8% rise in the second quarter still leaves it down 4.0% on the year to date.
- The UK market has seen a weaker recovery than most other markets, which may reflect the country’s response to the pandemic and, lingering in the background, the final Brexit deadline.
- In the UK, the more domestically oriented FTSE 250 rose faster than its FTSE 100 counterpart. Nevertheless, the FTSE 250 is still down 21.8% from the start of the year, whereas the Footsie has declined by 18.2%.
- The gap between the FTSE 350 Higher Yield and FTSE 350 Lower Yield performance underlines what a relatively bad quarter value investing has experienced. ‘Higher yield’ is not good news when the focus is on dividends being cut or suspended (think Shell). The implied historic dividend on the FTSE 100 has dropped by an eighth over the last three months.
- The best market performance for the year to date comes from China, which did not drop as sharply as other markets in Q1. Its performance has helped the MSCI Emerging Markets Index.
- Bond yields have generally fallen slightly, with the UK seeing the largest drops. UK gilts now have negative yields running out to six years and 30-year yields (0.64%) very close to those of Japan. ‘Japanification’ is a word we may have to get used to…
- One of the biggest rises, not shown in the table above, was in the price of oil. Brent crude started the quarter at $26.37 a barrel, while it ended June with a 58% increase.
The rally in global markets has perplexed some investors given the state of the pandemic. The next three months may prove whether those who say the strong Q2 shows unsentimental markets predicting a V-shaped economic recovery are correct.
Sources: FT, FTSE, MSCI, LSE, Stoxx, Investing.Com, Bank Of England, Federal Reserve, European Central Bank
This document is believed to be accurate but is not intended as a basis of knowledge upon which advice can be given. Neither the author (personal or corporate), the CII group, local institute or Society, or any of the officers or employees of those organisations accept any responsibility for any loss occasioned to any person acting or refraining from action as a result of the data or opinions included in this material. Opinions expressed are those of the author or authors and not necessarily those of the CII group, local institutes, or Societies.